Vaccine adverse outcomes
Reported Outcomes by Manufacturer
Sample data - % of 191,712 recipients

Below are samples of charts that Forge 4 Freedom can build for you with your own data to visually demonstrate your results.
Reported Outcomes by Manufacturer
Sample data - % of 191,712 recipients
Undisclosed Dark Money vs. Disclosed Spending.
Sample data — undisclosed political spending overtakes disclosed ($M).
Lobbying funds vs. Net Public Favorability.
Lobbying $M per sector (OpenSecrets, 2023) vs. net public favorability, % positive − % negative (Gallup Industry Ratings, 2023).
Public Trust in Institutions
Sample data — % of citizens expressing trust in government.
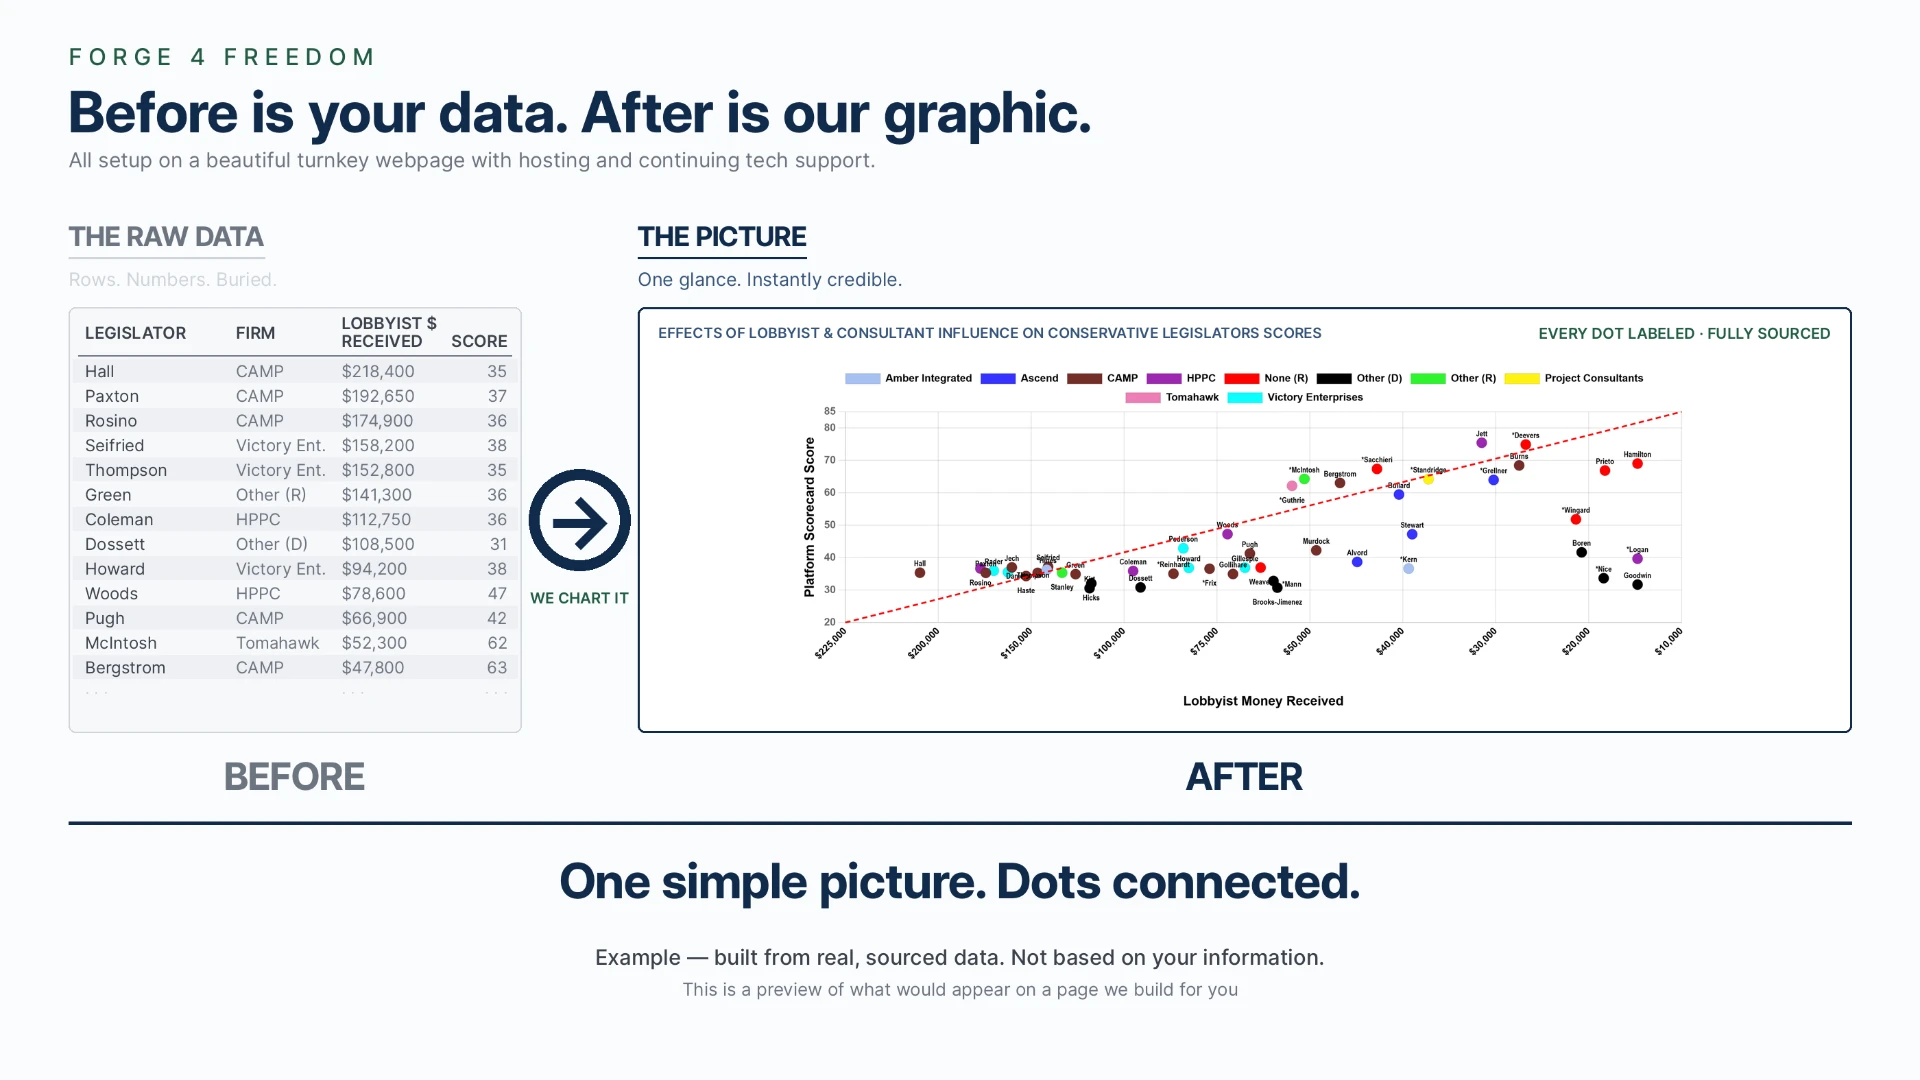
A sample of the work we're doing right now. Real clients, real data, real results.
Every chart Forge4Freedom publishes will be sourced, correlated, and open for scrutiny. The forge burns away what's hidden — what remains is the truth.

